
Indicator · MT4
v1.0.0
Indicator · MT4 Free resource
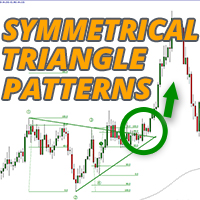
Free Download Symmetrical Triangle Patterns MT4
Free download Symmetrical Triangle Patterns for MetaTrader MT4. A symmetrical triangle chart pattern represents a period of contraction & consolidation before the price is forced to breakout to the upside or breakdown. A breakdown from the...
DeveloperLee Samson
- Version
- 1.0.0
- Platform
- MT4
- Downloads
- 515
- Views
- 400
- Updated
- Oct 2, 2026
- Delivery
- Direct download
- Package
- MT4 Package
Click Download Now to fetch the package safely.